
TM 11-6660-218-12
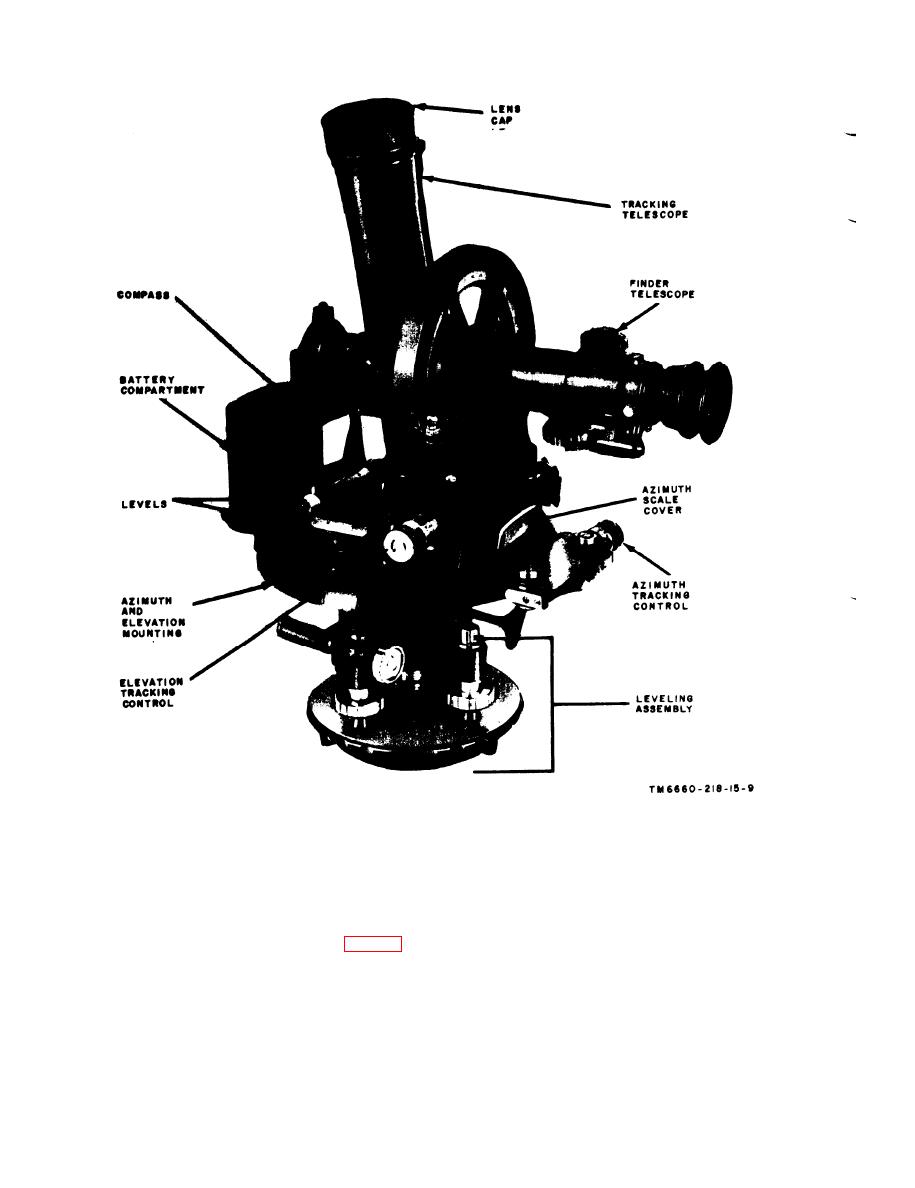
Figure 1-17. Theodolite.
left to right, short brown vertical lines or hatch-
1-10. Description of Minor Components
ing, and blue lines of constant density which curve
downward from left to right. The altitude pres-
a. Altitude Pressure-Density Chart (fig. 1-4).
sure-density chart is used to graphically deter-
This chart is made up of brown vertical lines
mine upper air density and temperature from
graduated in degrees centigrade ( 0 C), brown con-
figures obtained during an electronic observation.
stant pressure lines sloped slightly upward from
Change. 8
1-26

 Previous Page
